2. Taylor francis 🧠: over 2500+ questions licenced from 18 text-books worth £191
3. Past examiners 🫁: Questions written by previous Medical School examiners
4. Track your performance 🏃♀️: QBank uses intelegent software to keep you on track
The reviews are in
★★★★★
6,893 users
Don't take our word for it
"The stations you provide are strikingly similar to those I came across during my medical school finals (some even verbatim!), and I have tried many other exam platforms. I'm truly grateful for your priceless support throughout my final couple of years at medical school!"
Raza Q 🇬🇧
"It has absolutely everything for medical school, so many histories with detailed differential diagnoses, how to approach emergencies, commonly prescribed drugs..every kind go examination you’ll ever need in osces"
John R 🇬🇧
"Thank you SO MUCH for the amazing educational resource. I’ve tried lots of platforms and books with mock OSCE stations and yours is by far and away the best I’ve tried"
Ed M 🇳🇿
"Get this right away. So helpful for OSCEs but also general clinical learning and understanding. Wish I had brought it sooner"
Emma W 🇬🇧
"Without a doubt, your platform outshines all other OSCE resources currently available. In all honesty, I can confidently attribute my success in securing a distinction in my finals to OSCEstop."
Harish K 🇬🇧
"OSCEstop distinguishes itself from many other platform banks by offering a wealth of questions that mimic the demanding and complex aspects of our finals. This platform played a crucial role in ensuring I was ready for the level of difficulty that awaited me in my final exams."
Membership includes access to all 4 parts of the site:
1. Learning 📖: All notes, viva questions, track progress
2. Stations 🏥: 10 years of past medical school stations. Includes: heart murmurs, ECGs, ABGs, CXR
3. Qbank 🧠: 2500+ questions from Taylor Francis books, complete MLA coverage
4. Conditions 🫀: all conditions mapped to MLA, progress tracking
The reviews are in
★★★★★
6,893 users
Don't take our word for it
"The stations you provide are strikingly similar to those I came across during my medical school finals (some even verbatim!), and I have tried many other exam platforms. I'm truly grateful for your priceless support throughout my final couple of years at medical school!"
Raza Q 🇬🇧
"It has absolutely everything for medical school, so many histories with detailed differential diagnoses, how to approach emergencies, commonly prescribed drugs..every kind go examination you’ll ever need in osces"
John R 🇬🇧
"Thank you SO MUCH for the amazing educational resource. I’ve tried lots of platforms and books with mock OSCE stations and yours is by far and away the best I’ve tried"
Ed M 🇳🇿
"Get this right away. So helpful for OSCEs but also general clinical learning and understanding. Wish I had brought it sooner"
Emma W 🇬🇧
"Without a doubt, your platform outshines all other OSCE resources currently available. In all honesty, I can confidently attribute my success in securing a distinction in my finals to OSCEstop."
Harish K 🇬🇧
"OSCEstop distinguishes itself from many other platform banks by offering a wealth of questions that mimic the demanding and complex aspects of our finals. This platform played a crucial role in ensuring I was ready for the level of difficulty that awaited me in my final exams."
Standard voltage calibration: 10mm/mV (1mV deflection at start/end of trace should be 2 large squares in height)
Rate and rhythm
Square sizes
1 small square = 40 milliseconds
1 big square = 200 milliseconds
Use rhythm strip
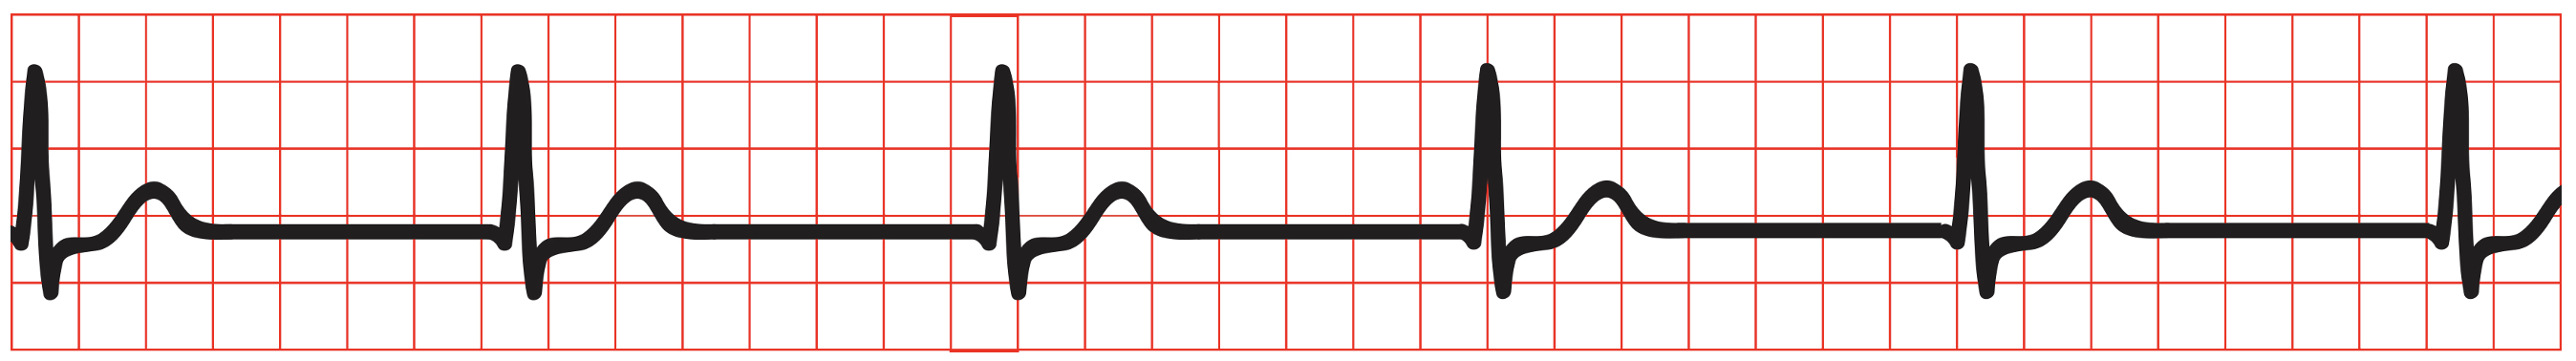
Rate: calculate by dividing 300 by number of large squares between R peaks OR, if irregular, total R waves on ECG multiplied by 6 (ECG is 10 seconds long)
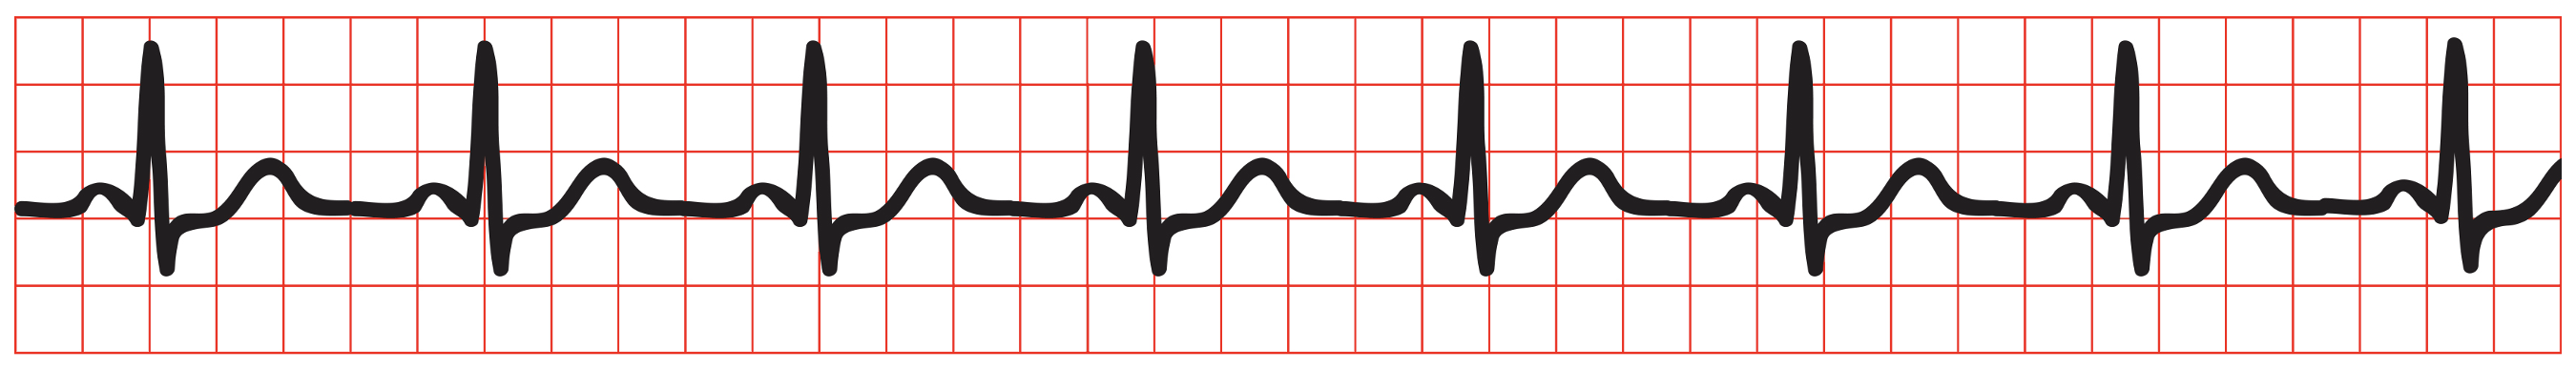
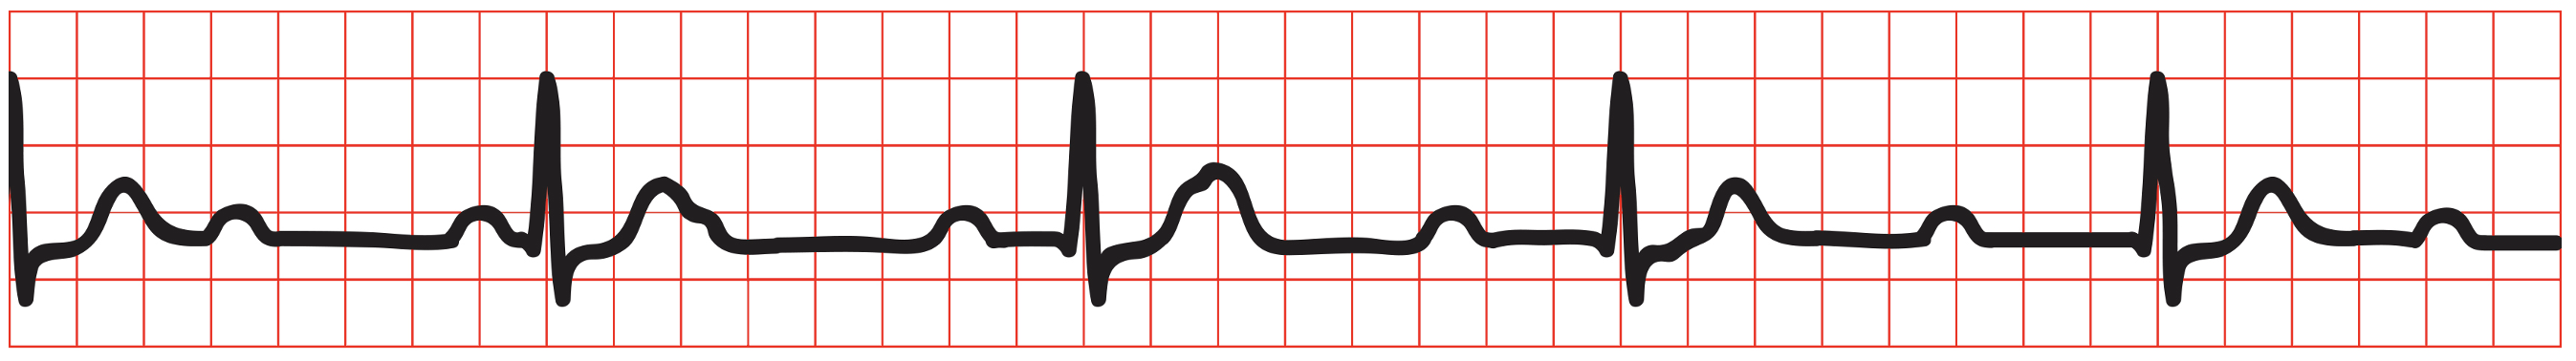
Regularity: mark four R wave peaks on a plain piece of paper and move it along the trace to compare regularity against subsequent R waves (irregular: AF, ectopics, 2nd degree heart block, sinus arrhythmia, atrial flutter with variable block)
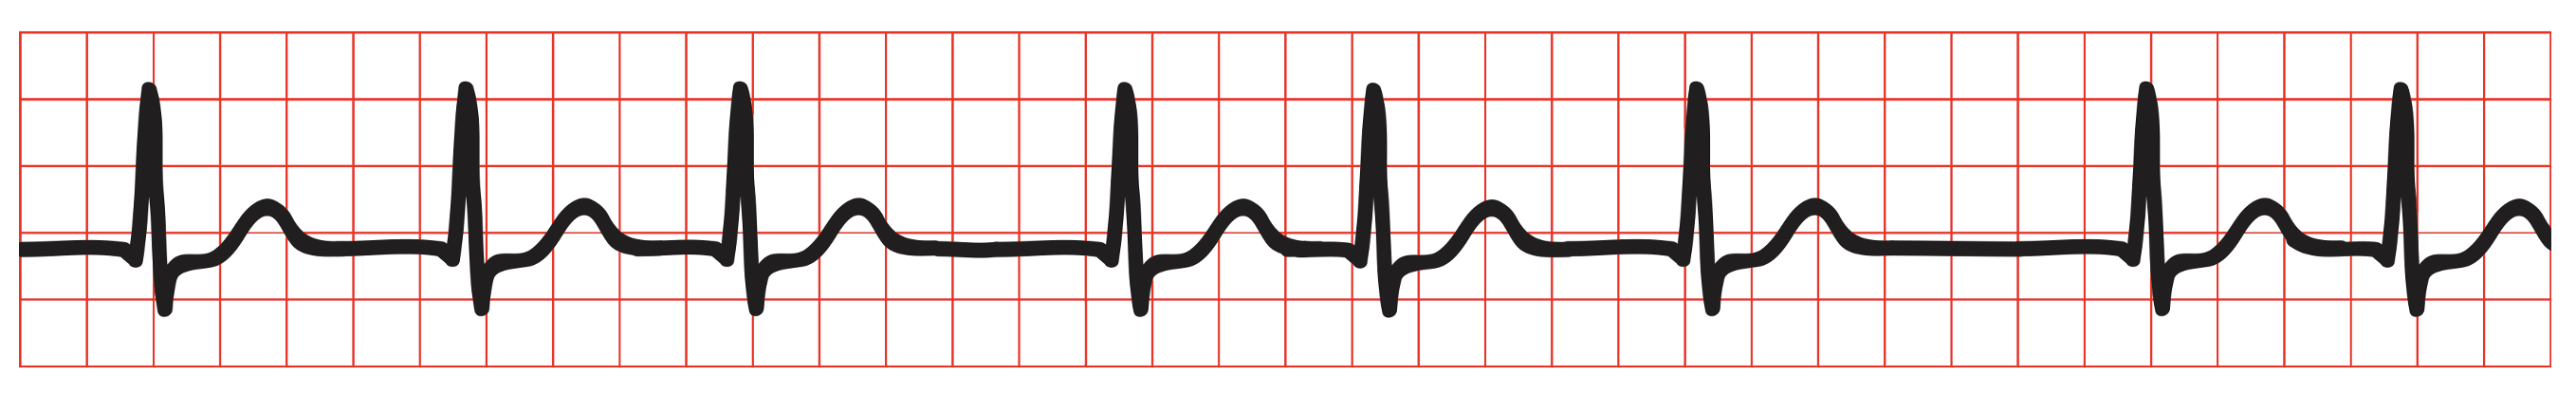
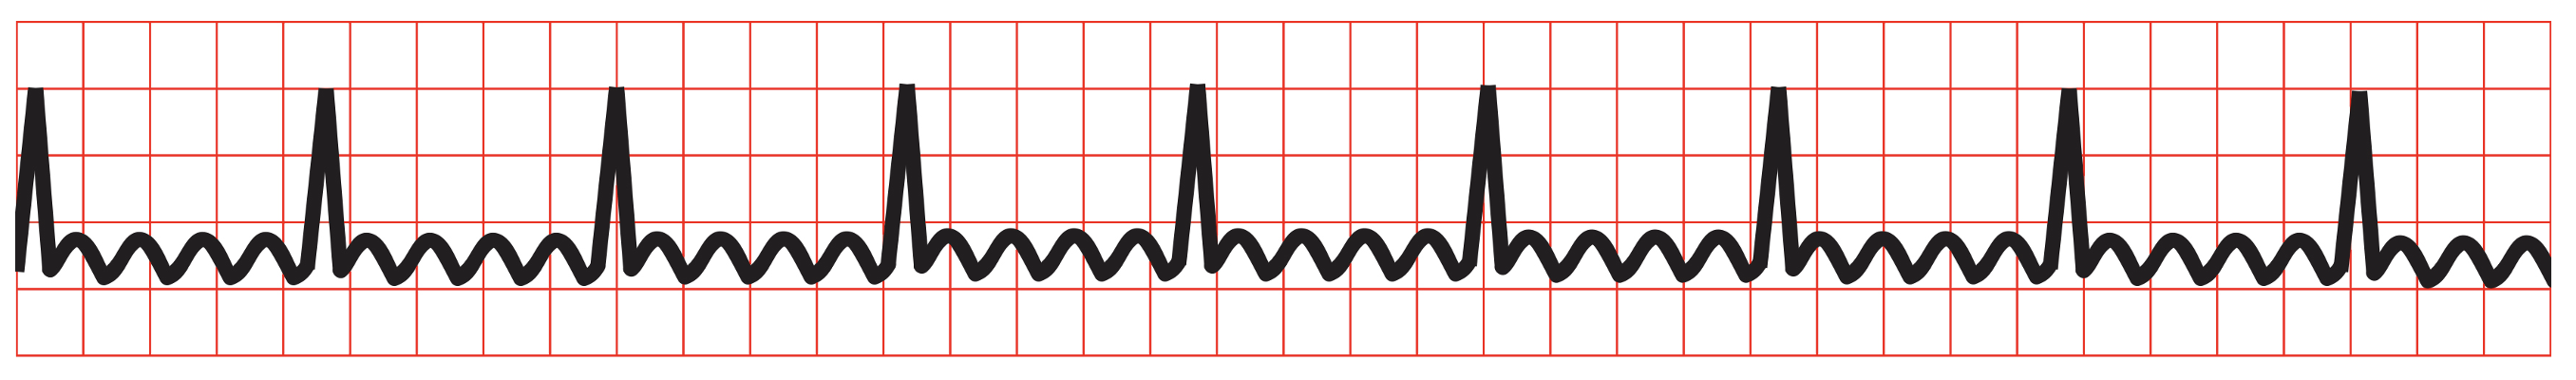
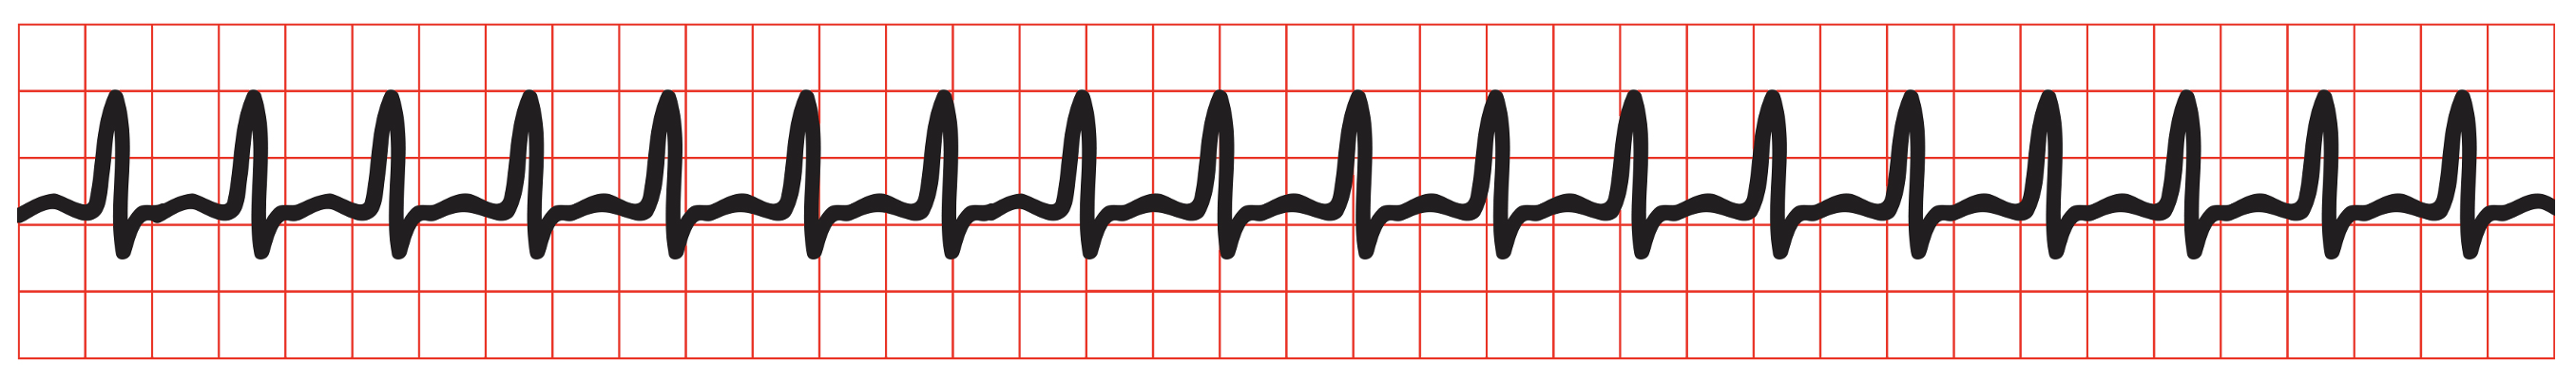
Sinus rhythm or not? Look for a normal P wave before each QRS complex (no clear P waves and irregular QRS = AF; saw-tooth baseline = atrial flutter; narrow complex tachycardia with abnormal or no discernible P waves = supraventricular tachycardia; broad complex tachycardia with no P waves = VF, VT or rarely SVT/AF with BBB/pre-excitation; bradycardia with no P waves = sinoatrial arrest with junctional or ventricular escape rhythm; P waves present but without constant PR interval = 2nd degree/complete heart block)
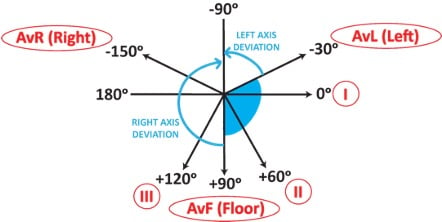
Short method: QRS is normally predominantly positive in leads I and II, i.e. both point upwards
If QRS is predominantly positive in lead I and negative in lead II (i.e. pointing away from each other), there is left axis deviation – Leaving each other = Left axis (more electricity going to left due to: LV hypertrophy, left anterior hemiblock, LBBB, inferior MI, Wolff-Parkinson-White syndrome, VT)
If the QRS is predominantly negative in lead I and positive in lead II (i.e. pointing towards each other), there is right axis deviation – Reaching towards each other = Right axis (more electricity going to right due to: tall and thin body type, RV hypertrophy (e.g. in PE, lung disease), left posterior hemiblock, lateral MI, Wolff-Parkinson-White syndrome)
P wave
Use rhythm strip
Height: should be ≤2 small squares (increased in right atrial enlargement, e.g. caused by pulmonary hypertension)
Morphology
Bifid (looks like an ‘m’) = P mitrale (left atrial enlargement – classically caused by mitral stenosis)
Peaked = P pulmonale (right atrial enlargement – classically in lung disease)
PR interval
Use rhythm strip
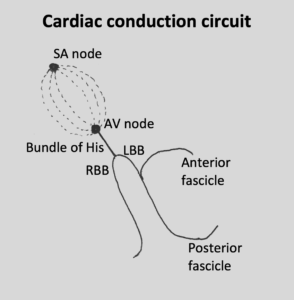
Cardiac conduction circuit
Length: should be 3-5 small squares
Decreased: accessory conduction pathway (look for delta wave in Wolff–Parkinson–White syndrome)
Increased in AV node block (‘heart block’)
1st degree heart block: PR >5 small squares and regular
2nd degree heart block
Mobitz type 1 (Wenckebach): PR progressively elongates until there is failure of conduction of an atrial beat (then the cycle repeats)
Mobitz type 2: constant PR interval in the conducted beats but some of the P waves are not conducted
2nd degree heart block with 2:1/3:1/4:1 block: alternate conducted and non-conducted atrial beats (P:QRS)
Complete heart block: complete dissociation between P waves and QRS complexes. Normal atrial beats are not conducted to ventricles, which results in the ventricles self-depolarising at a much slower rate (a ‘ventricular escape rhythm’).
QRS complex
Check in all leads
Q wave: note that small Q waves (<1 small square wide and <2 small squares deep) are normal in I, aVL and V6 (LV leads) due to septal depolarisation
Pathological Q waves(established/previous full thickness MI)
Use chest leads
R wave progression: QRS complexes should progress from mostly negative in V1 (i.e. dominant S) to mostly positive in V6 (i.e. dominant R). Normally the ‘transition point’ (i.e. the lead where R and S are equal) is V3/4.
‘Clockwise rotation’ i.e. transition point after V4 (right ventricular dilatation, usually caused by chronic lung disease)
Dominant R wave in V1/2 (right ventricular hypertrophy, posterior MI)
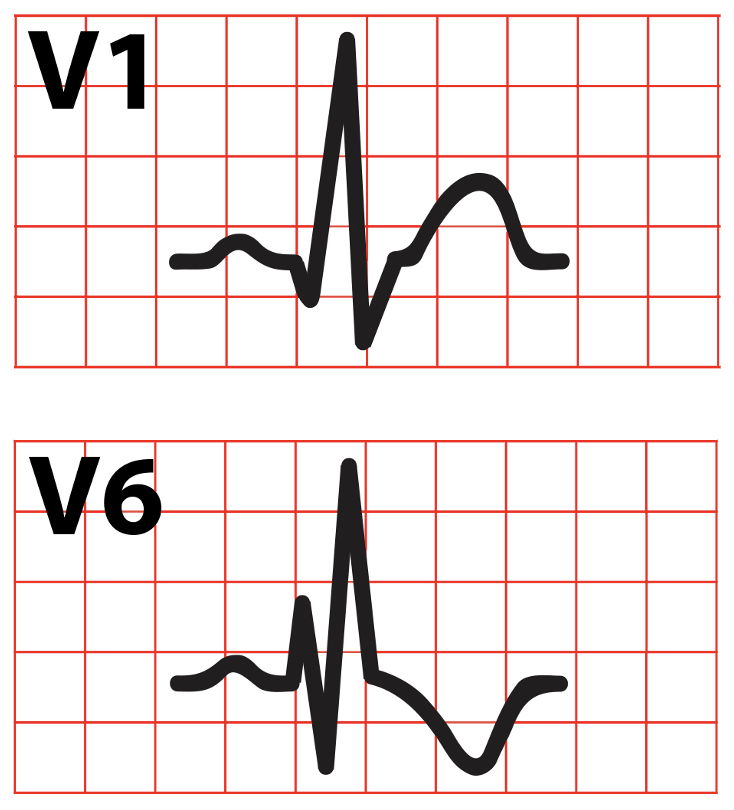
Use rhythm strip (and V1 and V6 if prolonged)
Length <3 small squares
Increased = bundle branch block
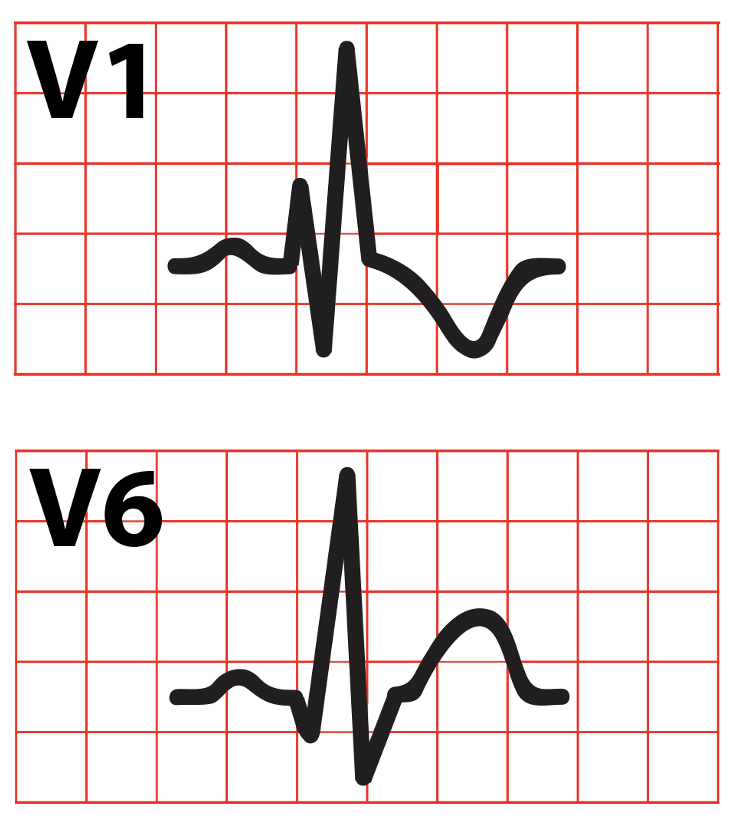
RBBB: QRS in V1 has M (RSR’) pattern and QRS in V6 has W pattern – MarroW (may be caused by: right ventricular hypertrophy/cor pulmonale, PE, atrial septal defect, ischaemic disease, cardiomyopathy)
LBBB: QRS in V1 has W pattern and QRS in V6 has M pattern – WilliaM (may be caused by: aortic stenosis, ischaemic disease, hypertension, anterior MI, cardiomyopathy, conduction system fibrosis, ↑K+)
NB: the W pattern is often not fully developed; the RSR’ pattern may be seen with a normal QRS length – this is partial (incomplete) bundle branch block and is of no clinical significance
Use V1 and V5/V6
Height: look for ventricular hypertrophy
S wave depth in V1 + tallest R wave in V5/6 = >7 big squares (left ventricular hypertrophy, e.g. hypertension, AS, AR, MR, coarctation of aorta, hypertrophic obstructive cardiomyopathy)
Dominant R wave in V1 + dominant S wave in V5/6 (right ventricular hypertrophy, e.g. pulmonary hypertension, MS, PE). If this is present, look for other signs too, e.g. T wave inversion in right chest leads (V1-V3) and right axis deviation.
Inversion: note it can be normal in III, aVR and V1 (right leads) due to the angle from which they view the heart (also in V2-3 in Afro-Caribbean patients). It’s almost always inverted in aVR.
Biphasic (ischaemia → up then down; hypokalaemia → down then up)
ST lead changes by infarct territory
Leads
Artery
Inferior
II, III, aVF
Right coronary
Anteroseptal
V1-V4
Left anterior descending
Anterolateral
V4-V5, I, aVL
Left anterior descending or left circumflex
Lateral
I, aVL ± V5-6
Left circumflex
Posterior
Dominant R wave V1-2, horizontal ST↓ V1-3
Left circumflex or right coronary
Other things
Use rhythm strip
Corrected QT interval (QTc): usually <450ms. It may be calculated by the ECG machine; if not, an online calculator can be used. It is likely prolonged if T waves extend beyond midpoint of RR interval. An increased QTc interval predisposes to polymorphic VT.
U waves– can be normal or seen in hypokalaemia, hypothermia, or with antiarrhythmics
Direction from which leads view the heart
Lead traces are deduced from the electric potential differences between certain electrodes. This means they can be said to ‘view’ the heart from different angles. A positive deflection is seen when the overall electric potential is travelling in the direction of that lead’s view, and a negative deflection is seen when the overall electric potential is travelling away from that lead’s view.
Transverse view
Coronal view
Common ECG pathologies you may see
Rhythm abnormalities
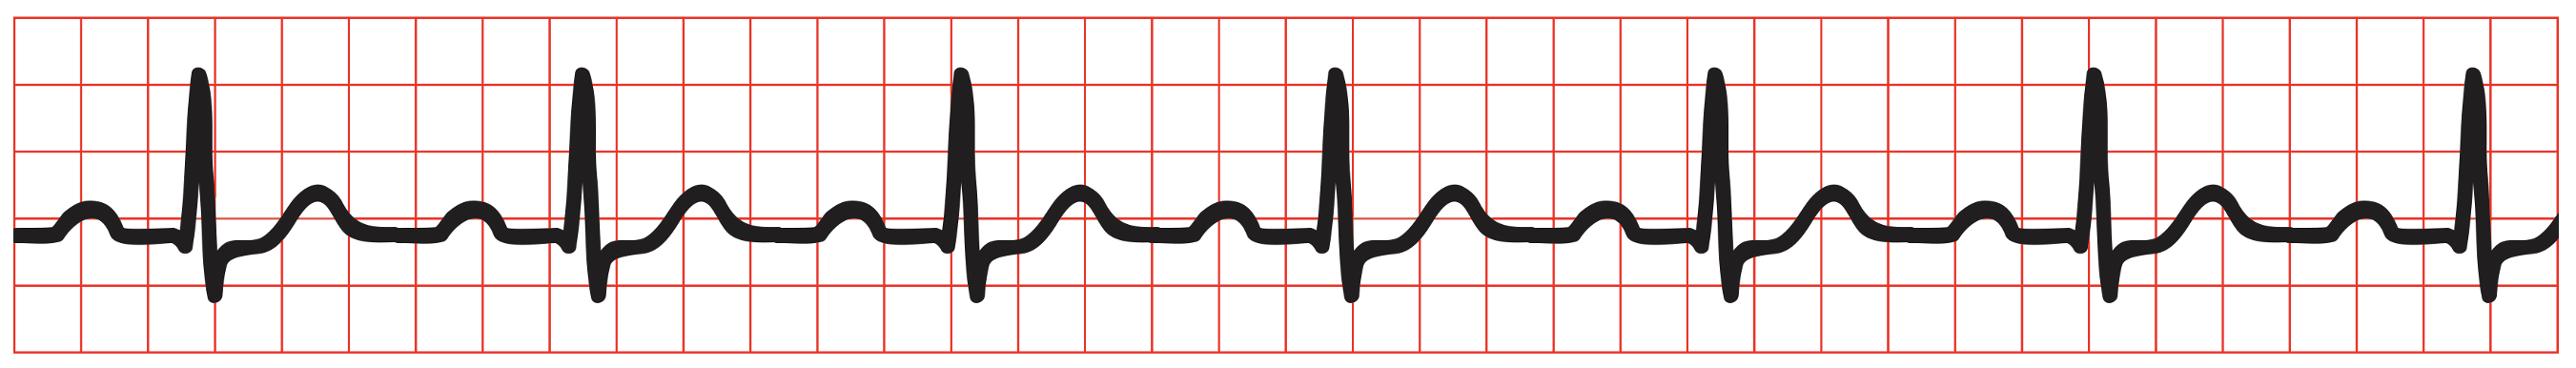
AF/flutter
AF: irregular without P waves
Atrial flutter: saw-tooth baseline (fluttering P waves) – may be regular with 2:1, 3:1 or 4:1 block, or irregular with variable block
Supraventricular tachycardias
Atrial tachycardia: regular with abnormal P waves
AV nodal re-entry tachycardia/AV re-entry tachycardia: regular, usually without discernible P waves
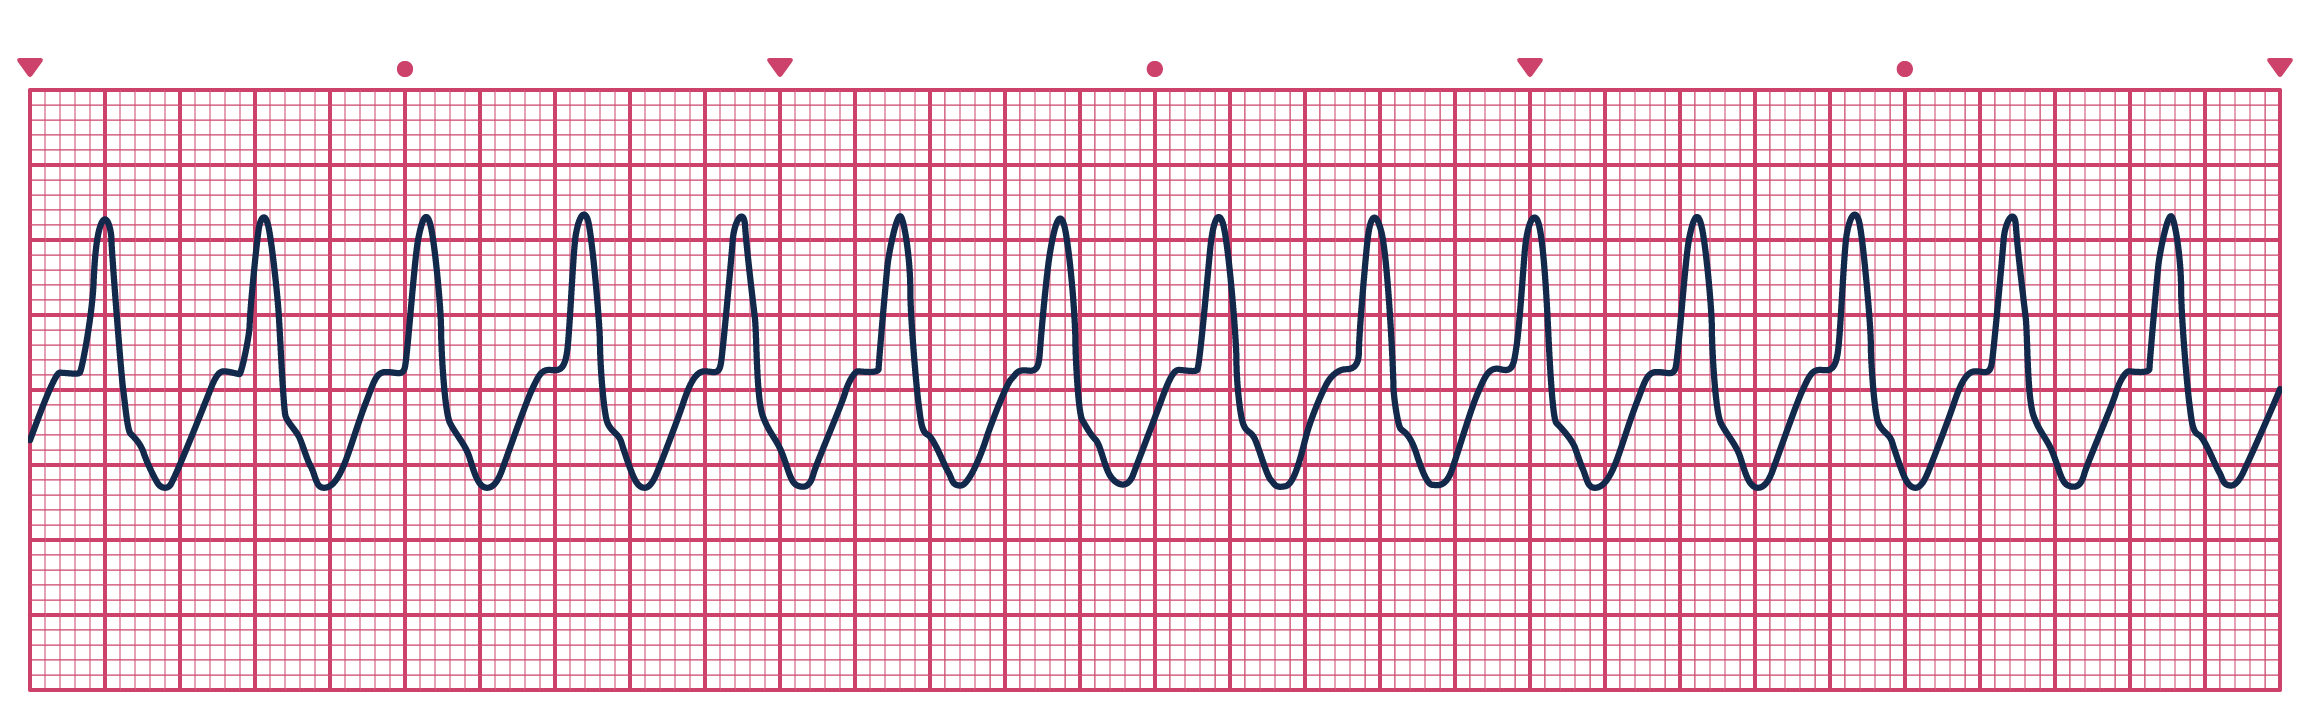
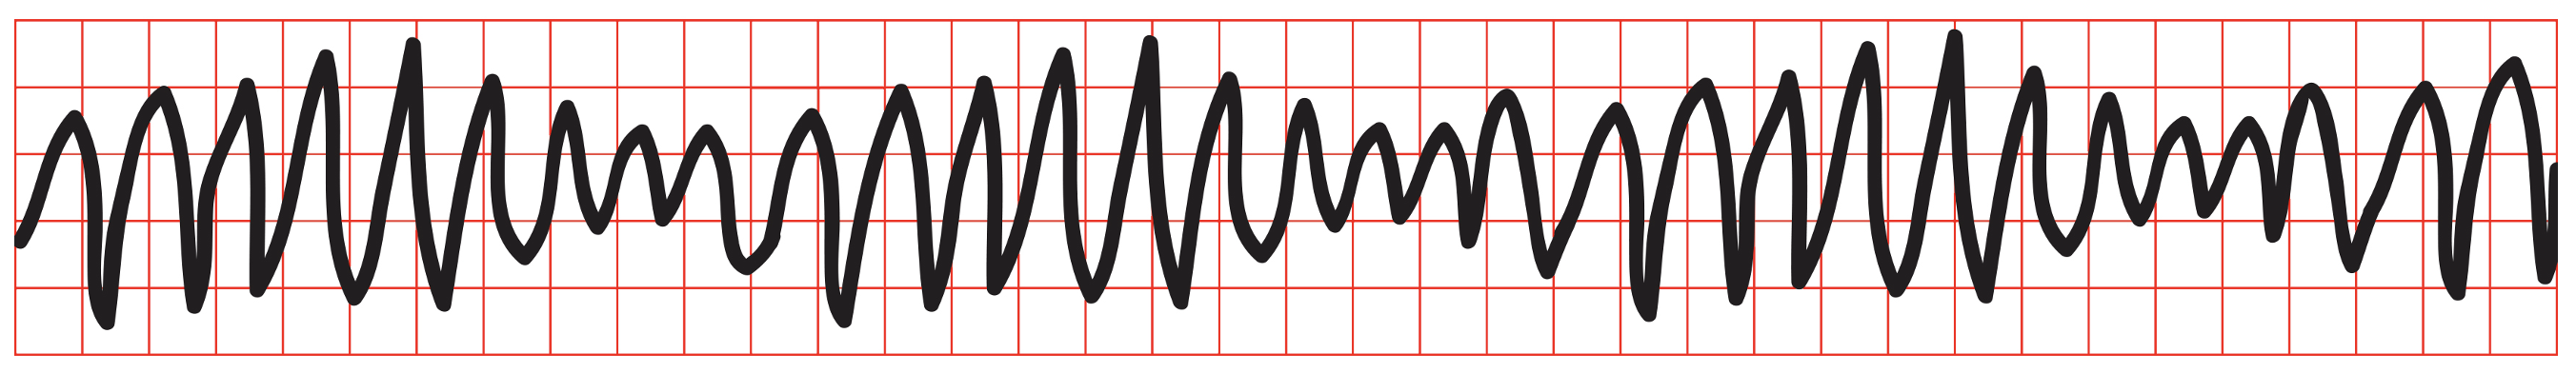
VT: regular, organised wavy line (broad complex tachycardia is VT until proven otherwise) – MAY BE PULSED VT OR PULSELESS VT
Polymorphic VT (Torsades de pointes): VT with varying amplitude
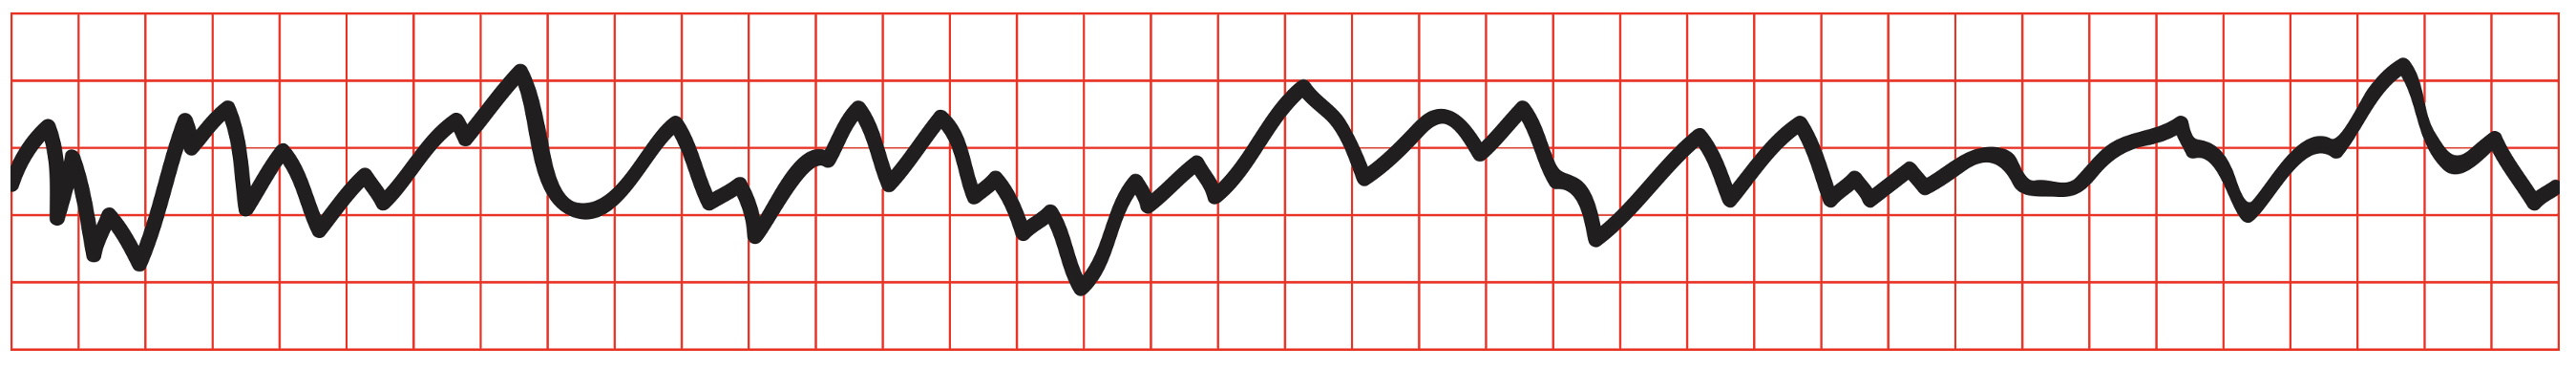
VF: random wavy line with no discernible P waves or QRS complexes – NO PULSE!
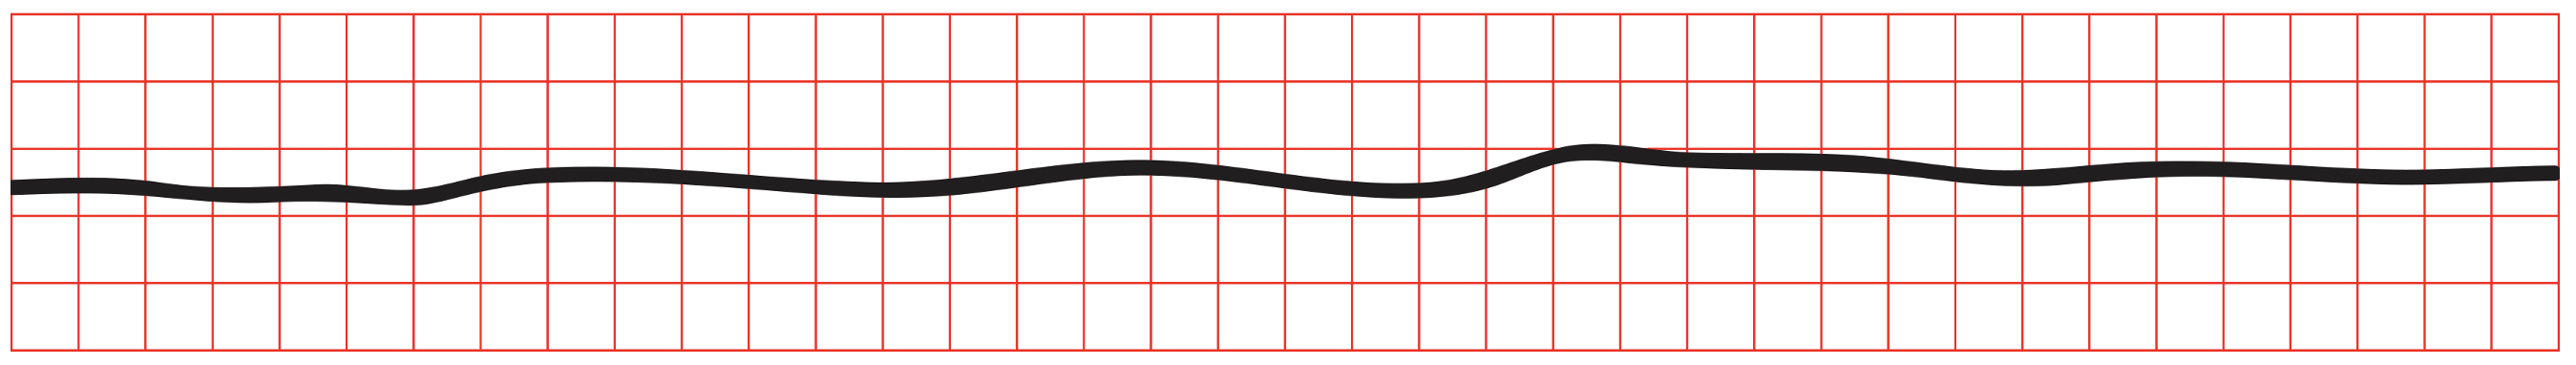
Asystole: flat line – NO PULSE!
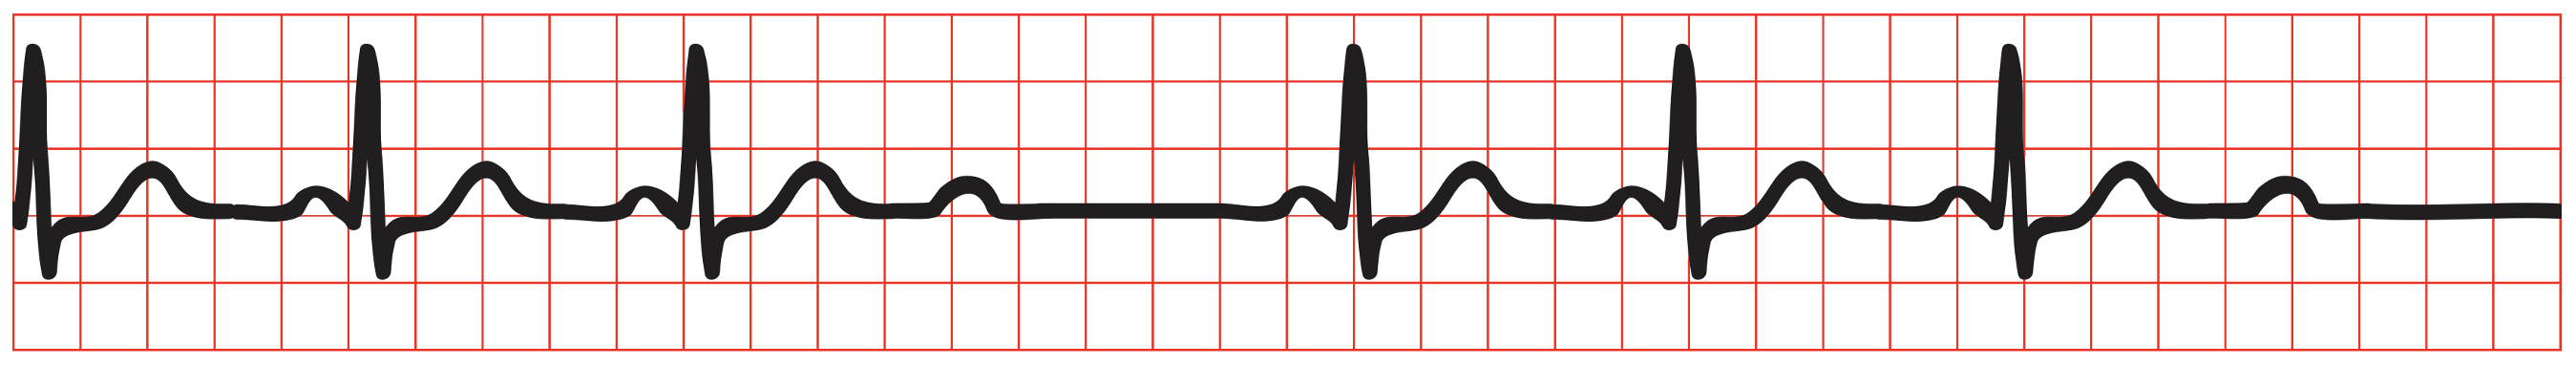
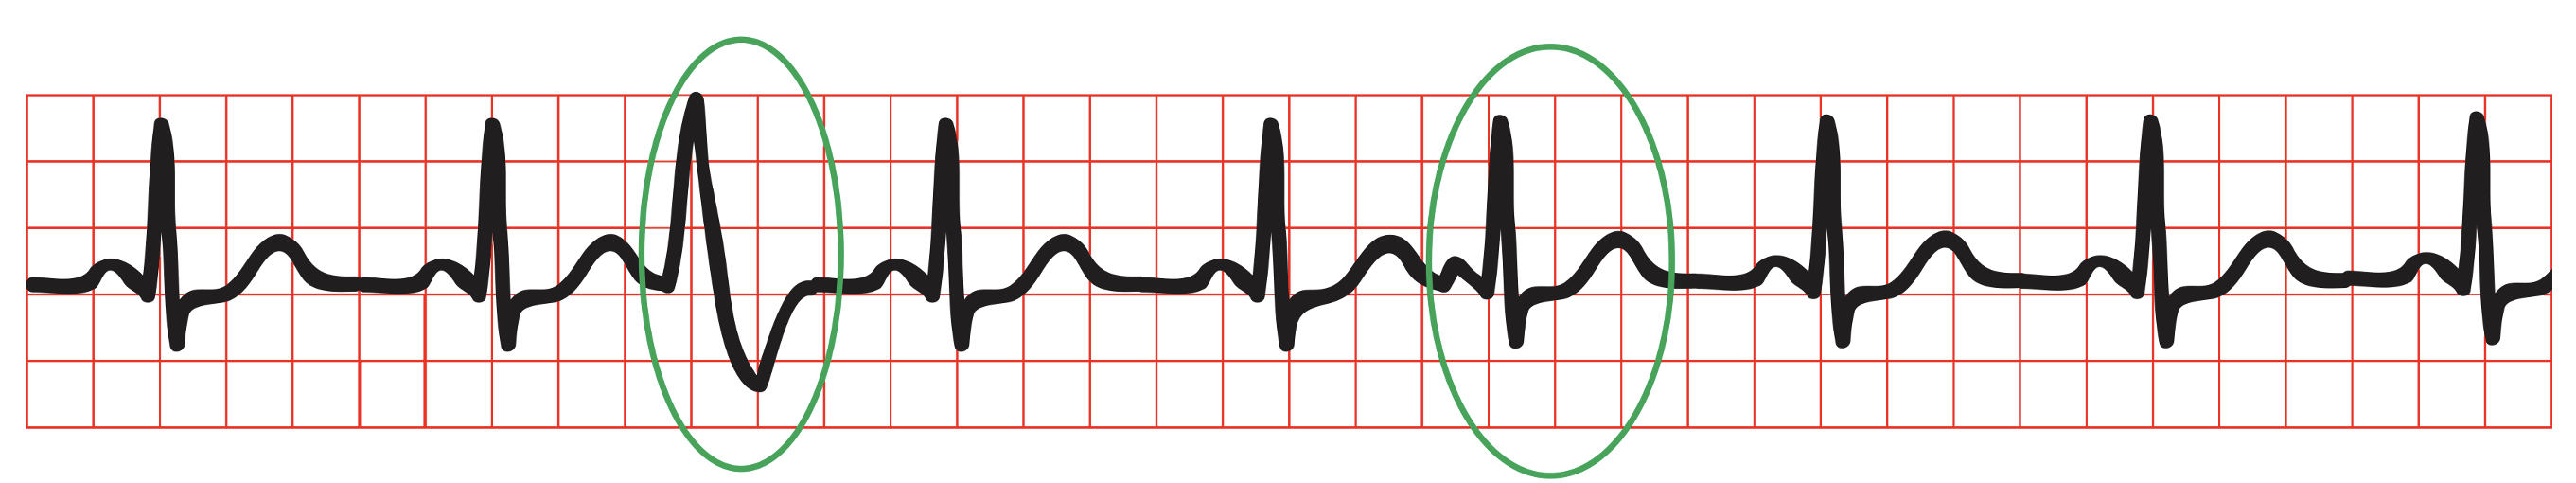
Atrial ectopic: narrow QRS ± preceding abnormal P wave (resets the P wave cycle)
Ventricular ectopic: abnormal broad QRS at abnormal time (usually followed by compensatory pause)
Ventricular bigeminy (regular ventricular ectopics): abnormal premature ventricular complexes after every normal complex
Perfusion abnormalities
Infarction: ST-elevation (first change), T wave inversion, pathological Q waves (signify full thickness MI and develop 8-12 hours after ST-elevation if myocardium is not reperfused)
STEMI criteria: ST-elevation in >2 small squares in 2 adjacent chest leads or ST-elevation > 1 small square in 2 adjacent limb leads or new LBBB
Ischaemia: ST-depression, new T wave inversion
Posterior (wall of LV) infarction: dominant R wave in V1/2 with horizontal ST-depression V1-3.
Previous infarcts: T wave inversion (persists weeks to months), pathological Q waves (permanent)
Hypertrophy
Left ventricular hypertrophy: left axis deviation, dominant S wave in V1, tall R wave (>5 big squares in V5/6), T wave inversion in lateral leads. Sokolow-Lyon voltage criteria: S depth in V1 + tallest R wave height in V5/6 = >7 big squares.
Right ventricular hypertrophy: right axis deviation, dominant R wave in V1, dominant S wave in V5/6, T wave inversion in right/inferior chest leads (V1-3, II, III, aVF)
Fascicular blocks
Any of the three conduction paths after the bundle of His can become blocked
Right bundle branch → RBBB pattern
Anterior fascicle of left bundle branch (i.e. left anterior hemiblock) → marked left axis deviation
Posterior fascicle of left bundle branch (i.e. left posterior hemiblock; rare) → marked right axis deviation
Bifascicular block is RBBB + left anterior/posterior hemiblock → RBBB + left/right axis deviation
Trifascicular block is RBBB + left anterior
‘Incomplete’ may be either of these patterns:
Fixed block of 2 fascicles + delayed conduction in remaining fascicle = bifascicular block + 1st/2nd degree heart block
Fixed block of 1 fascicle + intermittent failure of other 2 = RBBB + alternating left anterior/posterior hemiblock
NB: bifascicular block with 1st degree heart block is the most common pattern referred to as ‘trifascicular block’.
Metabolic
Hyperkalaemia: wide flat P waves, wide bizarre QRS, tall tented T waves
Hypokalaemia: prolonged PR, depressed ST, flattened/inverted T waves, prominent U wave
Hypercalcaemia: short QT interval
Hypocalcaemia: prolonged QT interval
Genetic conditions
Wolff-Parkinson-White syndrome: slurred upstroke into the QRS complex (delta wave), short PR interval, QRS complexes may be slightly broad, dominant R wave in V1 (if accessory pathway is left-sided, i.e. type A)/dominant S wave in V1 (if accessory pathway is right-sided, i.e. type B)
Hypertrophic cardiomyopathy: left ventricular hypertrophy signs + dramatic T wave inversion in lateral leads (maximal in V4 rather than V6)
Other conditions
PE – possible changes: tachycardia, right axis deviation, RA enlargement (i.e. P pulmonale), RBBB, RV dilation (i.e. dominant R in V1), RV strain (i.e. T wave inversion in right chest and inferior leads). NB: the ‘classical’ S1Q3T3 pattern (prominent S wave in lead I, and Q wave and inverted T wave in lead III) is uncommon.


Require more ECG examples, e.g. MI of the various locations.